Risto Oudman1, Tuija Mustonen1, Lauri Paasonen2, David Rice1
1 Orthodontics, Oral and Maxillofacial Diseases, University of Helsinki & Helsinki University Hospital,
Helsinki, Finland, 2 UPM Kymmene Oyj, Finland
INTRODUCTION
Osteosarcoma cell line MG-63 is widely used in studying osteoblast differentiation (1) as well as in cancer research (2). Growing osteosarcoma cells in 3D using synthetic non-toxic extracellular matrix and determining the viability with staining and high content confocal imaging provides information about cell viability while bridging the gap between in vitro and in vivo conditions. In this study the osteosarcoma cell line MG-63 was used to find a working method for spheroid formation in GrowDex®-T hydrogel. Analysis was done using different cell stains and with high content confocal microscopy. GrowDex-T has improved imaging properties compared to more traditional 3D cell culture matrixes.
MATERIALS
- Human osteosarcoma cell line MG-63 (ATCC® CRL-1427™)
- 96-well plate (CellCarrier-96 ultra, Black, Optically Clear Bottom, TC-Treated, PerkinElmer)
- Dulbecco’s Modified Eagle Medium (DMEM (1X), 4,5g/L D-glucose, with L-Glutamine and Pyruvate (Cat No. 41966-029 ,Gibco) supplemented with 10% FBS
- GrowDex-T 1.0% (Cat No. 200 103 005, UPM)
- Live/Dead Cell Double Staining Kit (Cat No. 04511-1KT-F, Sigma-Aldrich)
- NucBlue Live ReadyProbes Reagent (Cat No. R37605, Thermo Fisher Scientific)
- CellMask Orange Plasma membrane Stain (Cat No. C10045, Thermo Fisher Scientific)
METHODS
1.1.0% GrowDex-T was diluted to 0.2% working concentration. MG-63 cells were counted and solution made with 1000 cells/μL. The solution was combined with GrowDex-T and two different volumes of growth medium to make two solutions with cells densities of 200 cells/μL and 500 cells/μL. The solution containing GrowDex-T and the cell medium was mixed until the solution became homogenous.
2.50 μL of the solutions were added to each well of a 96-well plate. 50 μL of culture medium was added on top of hydrogel in each well to provide nutrition.
3.The cells were incubated for 72 h in 37°C, 5% CO2.
4.On the imaging day, two different staining solutions were prepared
1.2.5 μl of calcein AM and 2.5 μL of propidium iodide were added to 2.5 mL PBS.
2.Two drops of NucBlue and 1 μL of CellMask plasma membrane stain were added to each mL of DMEM.
5.First 50 μL of NucBlue and CellMask solution was added and incubated for 8 min in 37°C, 5% CO2. After the incubation a total volume of 80 μL of staining solution and excess medium were removed to avoid disrupting the cells.
6.Finally 50 μL of the Live/Dead (calcein AM/propidium iodide) cell double staining solution was added to each well. The live/dead staining solution was left in the wells.
7.Imaging was done with Opera Phenix High-Content Screening System (PerkinElmer). The image analysis was also carried out using the systems software.
RESULTS AND DISCUSSION
Three days after seeding and after staining the live MG-63 cells with Calcein AM, plasma membrane with CellMask Orange and nucleus with NucBlue, high cell viability was observed (Fig. 1). MG-63 cells also show organization towards the spheroid.
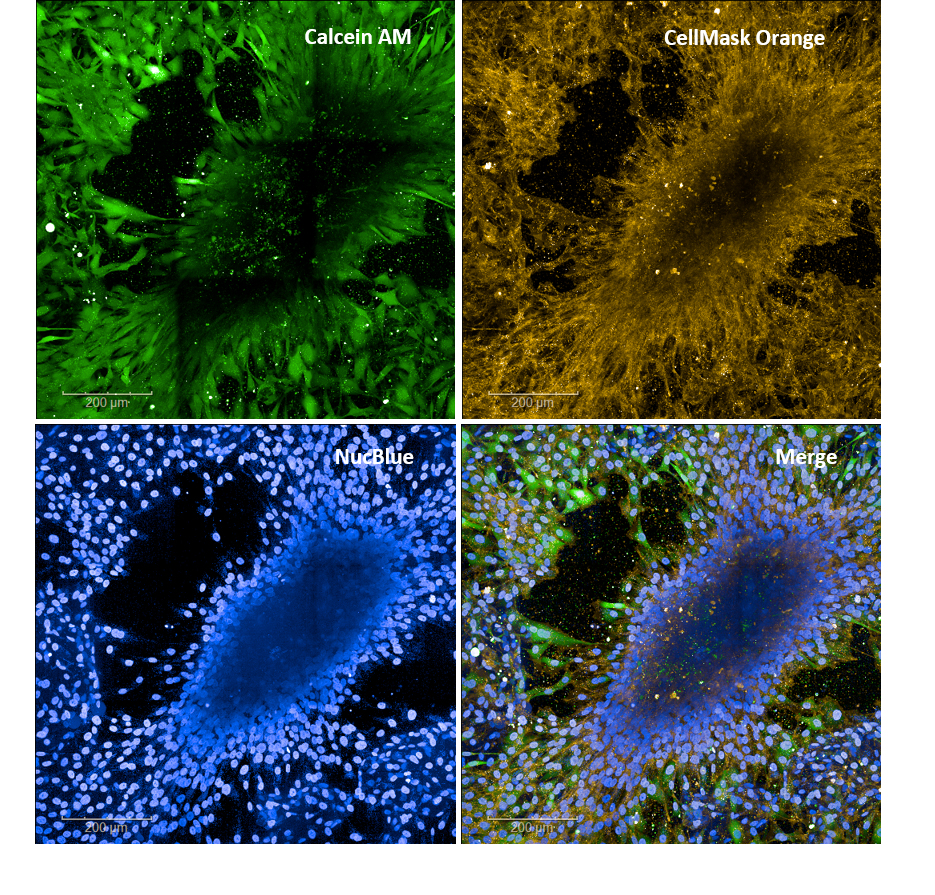
Figure 1. MG-63 cells stained with calcein AM for viable cells, CellMask Orange for staining the cell membranes, and NucBlue for cell nuclei. Cells show high viability and organization towards spheroid structure.
RESULTS AND DISCUSSION CONTD.
Clear elevated location of osteosarcoma cells forming was observed as seen in Fig. 2. The vertical z-coordinate in Figures 2 and 3 is 80 μm in height, which indicates the overall size of the spheroid. Note that Figures 2 and 3 show cells on the 96-well surface in addition to the spheroid structure. The 3D segmentation of single cells quantification, which was done using Opera Phenix software Harmony (PerkinElmer), is shown in Fig. 3B. Figure 3 also shows that on the bottom surface near the spheroid are less cells in comparison to cell population further away.
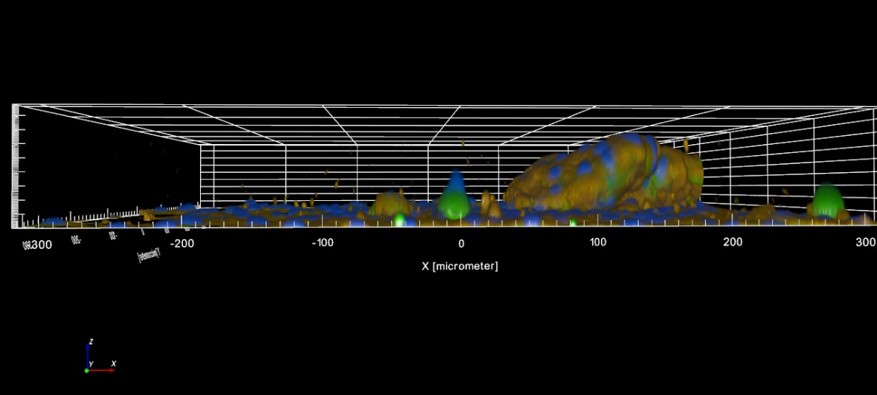
Figure 2. MG-63 cell spheroid in confocal microscope 3D-image captured with Opera Phenix High-Content Screening confocal microscope. The z-coordinate is 80 μm.
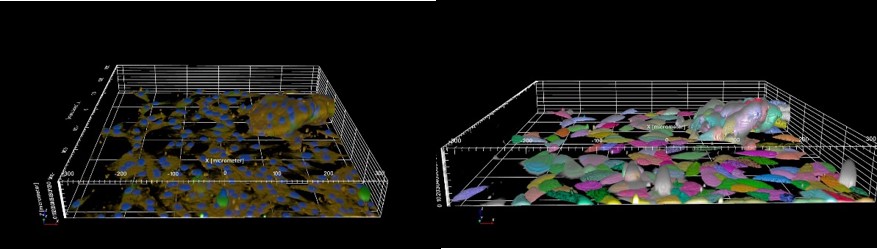
Figure 3. MG-63 cell population topography with staining (A), and 3D segmentation (B), captured with Opera Phenix High-Content Screening confocal microscope.
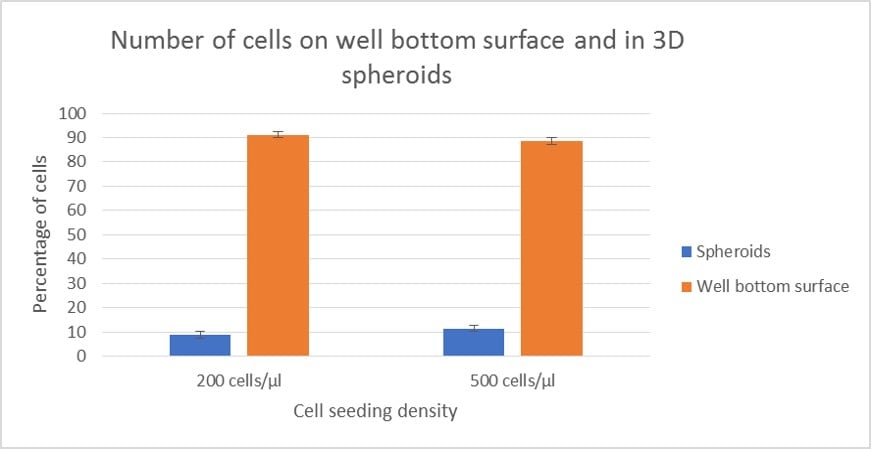
Analyzing the imaging data the cell population in bottom surface of the 96-well plate and in spheroids can be compared (Fig. 4). 200 cells/μL and 500 cells/μL seeding densities are shown in separate columns. The comparison is made with the assumption that cells above 24 μm from the well bottom are in spheroids and the ones under 24 μm form the 2D cell population. In lower seeding density approximately 9% of the cells are in spheroids. Whereas in higher seeding density the same figure is closer to 13%.
CONCLUSIONS
MG-63 osteosarcoma cells successfully form spheroids in GrowDex-T hydrogel and maintain high viability. GrowDex-T is a great matrix for imaging cells because it does not create background in the images when staining cells, and works well for high content imaging. While the experiment was done using two cell seeding densities, the results show both are suitable for spheroid forming. The spheroids differ in size and geometry. The improvements in high content imaging has made analyzing cells and spheroids increasingly more efficient. It is crucial to use 3D imaging and image analysis tools when analyzing 3D cell cultures.
ACKNOWLEDGEMENTS
Authors would like to thank Antti Hassinen, Institute for Molecular Medicine Finland, FIMM-HCA Biocenter Finland, Helmi platform, for valuable support in imaging.
REFERENCES
1.Zhang, M. , et al. 2014. “Knockdown of PRKAR1A, the Gene Responsible for Carney Complex, Interferes With Differentiation in Osteoblastic Cells.” Molecular Endocrinology, 28(3): 295–307.
2.Daft, P.G. , et al. 2013. “Alpha-CaMKII plays a critical role in determining the aggressive behavior of human osteosarcoma.” Molecular Cancer Research, 11(4): 349–359.